

Prometheus
Prometheus는 서버의 Endpoint에서 받는 리소스를 통해 이벤트 모니터링과 이벤트에 대한 경고 및 알람 기능을 제공한다.
Prometheus를 이용하기 위한 초기 세팅
build.gradle
// SpringBoot Actuator
implementation 'org.springframework.boot:spring-boot-starter-actuator'
// Prometheus
runtimeOnly 'io.micrometer:micrometer-registry-prometheus'서버 상태 리소스 확인을 위해 Endpoint 설정
Prometheus가 서버의 상태를 받기 위한 주소라고 생각하면 된다. 이 주소를 통해서 일정 시간 동안(기본값은 15초이다)의 반복 요청으로 서버의 Up, Down 여부를 확인할 수 있다. http://localhost:8080/actuator/prometheus Get 요청을 통해 서버 상태에 대한 로그를 확인할 수 있다. 또한 API의 성공/실패 양을 확인할 수 있다.
application.yml
management:
  endpoints:
    web:
      exposure:
include: prometheusprometheus.yml
# my global config
global:
  scrape_interval: 15s # Set the scrape interval to every 15 seconds. Default is every 1 minute.
  evaluation_interval: 15s # Evaluate rules every 15 seconds. The default is every 1 minute.
  # scrape_timeout is set to the global default (10s).

# Alertmanager configuration
alerting:
  alertmanagers:
    - static_configs:
        - targets:
          # - alertmanager:9093

# Load rules once and periodically evaluate them according to the global 'evaluation_interval'.
rule_files:
  # - "first_rules.yml"
  # - "second_rules.yml"

# A scrape configuration containing exactly one endpoint to scrape:
# Here it's Prometheus itself.
scrape_configs:
  # The job name is added as a label `job=<job_name>` to any timeseries scraped from this config.
  - job_name: "prometheus"

    # metrics_path defaults to '/metrics'
    # scheme defaults to 'http'.

    metrics_path: "/actuator/prometheus"
    static_configs:
- targets: ["localhost:8080"]Prometheus 접속 환경
기본 Grafana 주소는 http://localhost:9090/이며 Docker로 구동시킬 경우에는 적절한 Port 지정이 필요하다.
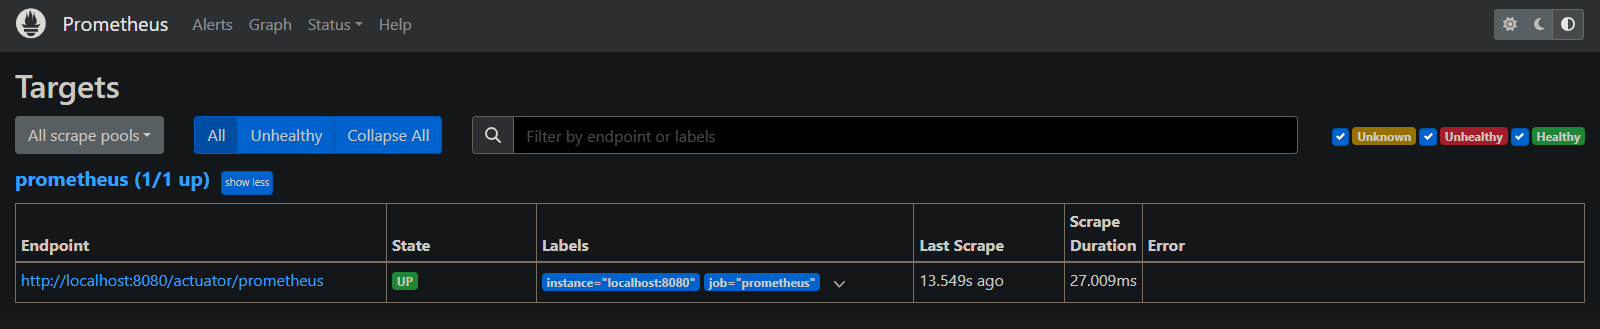
Prometheus Target Up/Down 조회
SpringCloud와 같이 MSA를 이용해 서비스를 분리한다면 각 서비스 별 endpoint를 통해 State를 확인하는 모니터링 페이지로 사용하면 좋을 것 같다.
Grafana
Grafana는 시계열 데이터에 대한 대시보드를 제공해주는 Data Visualization Tool이다. Prometheus의 시각화 기능이 부족하여 Grafana를 대신 시각 도구로 이용해 사용한다.


Grafana 접속 환경
기본 Grafana 주소는 http://localhost:3000/이며, Docker로 구동시킬 경우에는 적절한 Port 지정이 필요하다.
초기 로그인(아이디/비밀번호)
아래와 같이 초기 로그인을 통해 쉽게 접속할 수 있다.
ID  admin
PW adminPrometheus 검색 가능 변수
아래에 있는 변수들을 이용하여 Prometheus가 서버에서 가져오는 정보들을 나눠 Grafana 그래프로 가시화할 수 있다.
application_ready_time_seconds

application_started_time_seconds

disk_free_bytes

disk_total_bytes

executor_active_threads

executor_completed_tasks_total

executor_pool_core_threads

executor_pool_max_threads

executor_pool_size_threads

executor_queue_remaining_tasks

executor_queued_tasks

go_gc_duration_seconds

go_gc_duration_seconds_count

go_gc_duration_seconds_sum

go_goroutines

go_info

go_memstats_alloc_bytes

go_memstats_alloc_bytes_total

go_memstats_buck_hash_sys_bytes

go_memstats_frees_total

go_memstats_gc_sys_bytes

go_memstats_heap_alloc_bytes

go_memstats_heap_idle_bytes

go_memstats_heap_inuse_bytes

go_memstats_heap_objects

go_memstats_heap_released_bytes

go_memstats_heap_sys_bytes

go_memstats_last_gc_time_seconds

go_memstats_lookups_total

go_memstats_mallocs_total

go_memstats_mcache_inuse_bytes

go_memstats_mcache_sys_bytes

go_memstats_mspan_inuse_bytes

go_memstats_mspan_sys_bytes

go_memstats_next_gc_bytes

go_memstats_other_sys_bytes

go_memstats_stack_inuse_bytes

go_memstats_stack_sys_bytes

go_memstats_sys_bytes

go_threads

http_server_requests_active_seconds_active_count

http_server_requests_active_seconds_duration_sum

http_server_requests_active_seconds_max

http_server_requests_seconds_count

http_server_requests_seconds_max

http_server_requests_seconds_sum

jvm_buffer_count_buffers

jvm_buffer_memory_used_bytes

jvm_buffer_total_capacity_bytes

jvm_classes_loaded_classes

jvm_classes_unloaded_classes_total

jvm_compilation_time_ms_total

jvm_gc_live_data_size_bytes

jvm_gc_max_data_size_bytes

jvm_gc_memory_allocated_bytes_total

jvm_gc_memory_promoted_bytes_total

jvm_gc_overhead_percent

jvm_info

jvm_memory_committed_bytes

jvm_memory_max_bytes

jvm_memory_usage_after_gc_percent

jvm_memory_used_bytes

jvm_threads_daemon_threads

jvm_threads_live_threads

jvm_threads_peak_threads

jvm_threads_started_threads_total

jvm_threads_states_threads

logback_events_total

net_conntrack_dialer_conn_attempted_total

net_conntrack_dialer_conn_closed_total

net_conntrack_dialer_conn_established_total

net_conntrack_dialer_conn_failed_total

net_conntrack_listener_conn_accepted_total

net_conntrack_listener_conn_closed_total

process_cpu_seconds_total

process_cpu_usage

process_max_fds

process_open_fds

process_resident_memory_bytes

process_start_time_seconds

process_uptime_seconds

process_virtual_memory_bytes

prometheus_api_remote_read_queries

prometheus_build_info

prometheus_config_last_reload_success_timestamp_seconds

prometheus_config_last_reload_successful

prometheus_engine_queries

prometheus_engine_queries_concurrent_max

prometheus_engine_query_duration_seconds

prometheus_engine_query_duration_seconds_count

prometheus_engine_query_duration_seconds_sum

prometheus_engine_query_log_enabled

prometheus_engine_query_log_failures_total

prometheus_engine_query_samples_total

prometheus_http_request_duration_seconds_bucket

prometheus_http_request_duration_seconds_count

prometheus_http_request_duration_seconds_sum

prometheus_http_requests_total

prometheus_http_response_size_bytes_bucket

prometheus_http_response_size_bytes_count

prometheus_http_response_size_bytes_sum

prometheus_notifications_alertmanagers_discovered

prometheus_notifications_dropped_total

prometheus_notifications_queue_capacity

prometheus_notifications_queue_length

prometheus_ready

prometheus_remote_storage_exemplars_in_total

prometheus_remote_storage_highest_timestamp_in_seconds

prometheus_remote_storage_histograms_in_total

prometheus_remote_storage_samples_in_total

prometheus_remote_storage_string_interner_zero_reference_releases_total

prometheus_rule_evaluation_duration_seconds

prometheus_rule_evaluation_duration_seconds_count

prometheus_rule_evaluation_duration_seconds_sum

prometheus_rule_group_duration_seconds

prometheus_rule_group_duration_seconds_count

prometheus_rule_group_duration_seconds_sum

prometheus_sd_azure_cache_hit_total

prometheus_sd_azure_failures_total

prometheus_sd_consul_rpc_duration_seconds

prometheus_sd_consul_rpc_duration_seconds_count

prometheus_sd_consul_rpc_duration_seconds_sum

prometheus_sd_consul_rpc_failures_total

prometheus_sd_discovered_targets

prometheus_sd_dns_lookup_failures_total

prometheus_sd_dns_lookups_total

prometheus_sd_failed_configs

prometheus_sd_file_read_errors_total

prometheus_sd_file_scan_duration_seconds

prometheus_sd_file_scan_duration_seconds_count

prometheus_sd_file_scan_duration_seconds_sum

prometheus_sd_file_watcher_errors_total

prometheus_sd_http_failures_total

prometheus_sd_kubernetes_events_total

prometheus_sd_kuma_fetch_duration_seconds

prometheus_sd_kuma_fetch_duration_seconds_count

prometheus_sd_kuma_fetch_duration_seconds_sum

prometheus_sd_kuma_fetch_failures_total

prometheus_sd_kuma_fetch_skipped_updates_total

prometheus_sd_linode_failures_total

prometheus_sd_nomad_failures_total

prometheus_sd_received_updates_total

prometheus_sd_updates_delayed_total

prometheus_sd_updates_total

prometheus_target_interval_length_seconds

prometheus_target_interval_length_seconds_count

prometheus_target_interval_length_seconds_sum

prometheus_target_metadata_cache_bytes

prometheus_target_metadata_cache_entries

prometheus_target_scrape_pool_exceeded_label_limits_total

prometheus_target_scrape_pool_exceeded_target_limit_total

prometheus_target_scrape_pool_reloads_failed_total

prometheus_target_scrape_pool_reloads_total

prometheus_target_scrape_pool_sync_total

prometheus_target_scrape_pool_target_limit

prometheus_target_scrape_pool_targets

prometheus_target_scrape_pools_failed_total

prometheus_target_scrape_pools_total

prometheus_target_scrapes_cache_flush_forced_total

prometheus_target_scrapes_exceeded_body_size_limit_total

prometheus_target_scrapes_exceeded_native_histogram_bucket_limit_total

prometheus_target_scrapes_exceeded_sample_limit_total

prometheus_target_scrapes_exemplar_out_of_order_total

prometheus_target_scrapes_sample_duplicate_timestamp_total

prometheus_target_scrapes_sample_out_of_bounds_total

prometheus_target_scrapes_sample_out_of_order_total

prometheus_target_sync_failed_total

prometheus_target_sync_length_seconds

prometheus_target_sync_length_seconds_count

prometheus_target_sync_length_seconds_sum

prometheus_template_text_expansion_failures_total

prometheus_template_text_expansions_total

prometheus_treecache_watcher_goroutines

prometheus_treecache_zookeeper_failures_total

prometheus_tsdb_blocks_loaded

prometheus_tsdb_checkpoint_creations_failed_total

prometheus_tsdb_checkpoint_creations_total

prometheus_tsdb_checkpoint_deletions_failed_total

prometheus_tsdb_checkpoint_deletions_total

prometheus_tsdb_clean_start

prometheus_tsdb_compaction_chunk_range_seconds_bucket

prometheus_tsdb_compaction_chunk_range_seconds_count

prometheus_tsdb_compaction_chunk_range_seconds_sum

prometheus_tsdb_compaction_chunk_samples_bucket

prometheus_tsdb_compaction_chunk_samples_count

prometheus_tsdb_compaction_chunk_samples_sum

prometheus_tsdb_compaction_chunk_size_bytes_bucket

prometheus_tsdb_compaction_chunk_size_bytes_count

prometheus_tsdb_compaction_chunk_size_bytes_sum

prometheus_tsdb_compaction_duration_seconds_bucket

prometheus_tsdb_compaction_duration_seconds_count

prometheus_tsdb_compaction_duration_seconds_sum

prometheus_tsdb_compaction_populating_block

prometheus_tsdb_compactions_failed_total

prometheus_tsdb_compactions_skipped_total

prometheus_tsdb_compactions_total

prometheus_tsdb_compactions_triggered_total

prometheus_tsdb_data_replay_duration_seconds

prometheus_tsdb_exemplar_exemplars_appended_total

prometheus_tsdb_exemplar_exemplars_in_storage

prometheus_tsdb_exemplar_last_exemplars_timestamp_seconds

prometheus_tsdb_exemplar_max_exemplars

prometheus_tsdb_exemplar_out_of_order_exemplars_total

prometheus_tsdb_exemplar_series_with_exemplars_in_storage

prometheus_tsdb_head_active_appenders

prometheus_tsdb_head_chunks

prometheus_tsdb_head_chunks_created_total

prometheus_tsdb_head_chunks_removed_total

prometheus_tsdb_head_chunks_storage_size_bytes

prometheus_tsdb_head_gc_duration_seconds_count

prometheus_tsdb_head_gc_duration_seconds_sum

prometheus_tsdb_head_max_time

prometheus_tsdb_head_max_time_seconds

prometheus_tsdb_head_min_time

prometheus_tsdb_head_min_time_seconds

prometheus_tsdb_head_out_of_order_samples_appended_total

prometheus_tsdb_head_samples_appended_total

prometheus_tsdb_head_series

prometheus_tsdb_head_series_created_total

prometheus_tsdb_head_series_not_found_total

prometheus_tsdb_head_series_removed_total

prometheus_tsdb_head_truncations_failed_total

prometheus_tsdb_head_truncations_total

prometheus_tsdb_isolation_high_watermark

prometheus_tsdb_isolation_low_watermark

prometheus_tsdb_lowest_timestamp

prometheus_tsdb_lowest_timestamp_seconds

prometheus_tsdb_mmap_chunk_corruptions_total

prometheus_tsdb_mmap_chunks_total

prometheus_tsdb_out_of_bound_samples_total

prometheus_tsdb_out_of_order_samples_total

prometheus_tsdb_reloads_failures_total

prometheus_tsdb_reloads_total

prometheus_tsdb_retention_limit_bytes

prometheus_tsdb_retention_limit_seconds

prometheus_tsdb_size_retentions_total

prometheus_tsdb_snapshot_replay_error_total

prometheus_tsdb_storage_blocks_bytes

prometheus_tsdb_symbol_table_size_bytes

prometheus_tsdb_time_retentions_total

prometheus_tsdb_tombstone_cleanup_seconds_bucket

prometheus_tsdb_tombstone_cleanup_seconds_count

prometheus_tsdb_tombstone_cleanup_seconds_sum

prometheus_tsdb_too_old_samples_total

prometheus_tsdb_vertical_compactions_total

prometheus_tsdb_wal_completed_pages_total

prometheus_tsdb_wal_corruptions_total

prometheus_tsdb_wal_fsync_duration_seconds

prometheus_tsdb_wal_fsync_duration_seconds_count

prometheus_tsdb_wal_fsync_duration_seconds_sum

prometheus_tsdb_wal_page_flushes_total

prometheus_tsdb_wal_segment_current

prometheus_tsdb_wal_storage_size_bytes

prometheus_tsdb_wal_truncate_duration_seconds_count

prometheus_tsdb_wal_truncate_duration_seconds_sum

prometheus_tsdb_wal_truncations_failed_total

prometheus_tsdb_wal_truncations_total

prometheus_tsdb_wal_writes_failed_total

prometheus_web_federation_errors_total

prometheus_web_federation_warnings_total

promhttp_metric_handler_requests_in_flight

promhttp_metric_handler_requests_total

scrape_duration_seconds

scrape_samples_post_metric_relabeling

scrape_samples_scraped

scrape_series_added

system_cpu_count

system_cpu_usage

tomcat_sessions_active_current_sessions

tomcat_sessions_active_max_sessions

tomcat_sessions_alive_max_seconds

tomcat_sessions_created_sessions_total

tomcat_sessions_expired_sessions_total

tomcat_sessions_rejected_sessions_total

up
'SpringBoot' 카테고리의 다른 글
| [SpringBoot/스프링부트] Record (0) | 2024.02.27 |
|---|---|
| [Spring/스프링] JPA CompositeKey 복합키 설정 (0) | 2024.02.21 |